Singapore is the largest data centre market in Southeast Asia by live capacity — and one of the most space- and power-constrained. Operators here can’t simply build their way past a cooling problem the way they might elsewhere in the region. Running high-density AI clusters and enterprise server hardware in a hyper-tropical, high-humidity climate, on a tightly rationed power and land footprint, means localised thermal hot spots aren’t just an inconvenience. They trigger automatic equipment throttling, accelerate component wear, and — left unaddressed — cause the kind of facility downtime that ends up in a board report. We explore how CFD prevents hot spots through simulation early on.
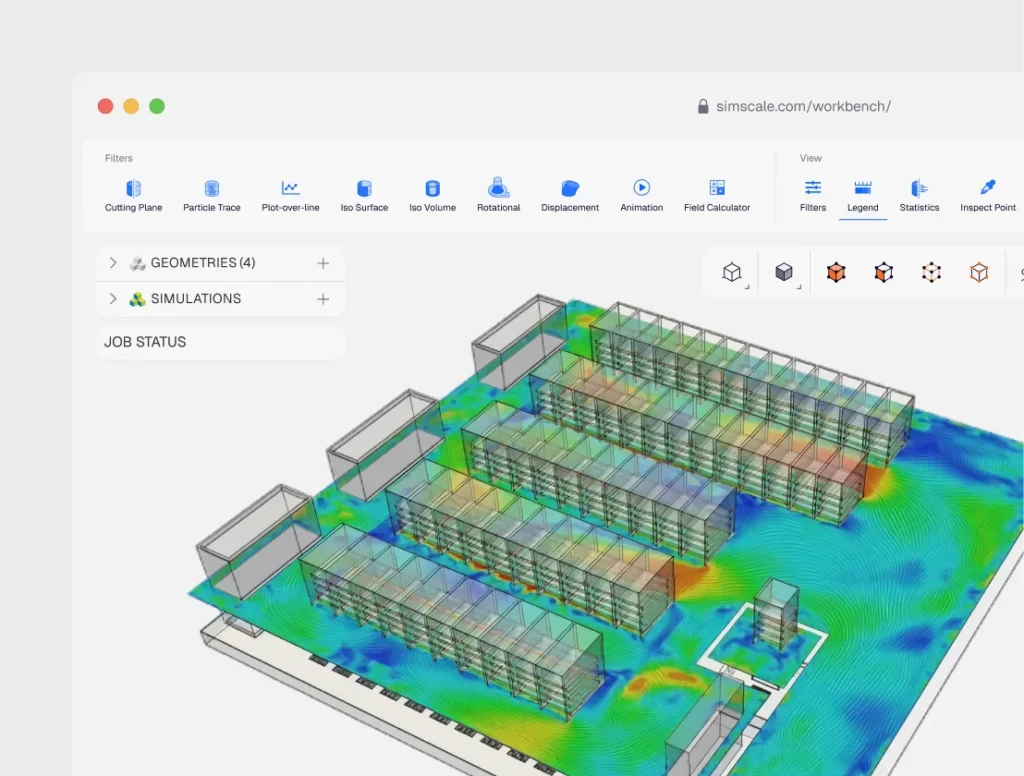
Quick summary: Computational Fluid Dynamics (CFD) simulation — a way of using physics equations to model how air actually moves and heats up inside a space — acts as a predictive digital twin for a data hall’s airflow. By solving the equations governing air velocity, pressure, and heat transfer, CFD exposes thermal stagnation points and air recirculation paths before they threaten hardware. That lets operators scale server density safely while meeting Singapore’s increasingly strict efficiency rules — rules that, as of 2026, now gate access to new data centre capacity itself, not just certification.
The Silent Threat: How Micro-Climates Cause Data Hall Downtime
A thermal hot spot is rarely caused by a plain shortage of chilling capacity. It’s usually an aerodynamics failure inside the server room — the total cooling on paper is fine, but the air isn’t reaching the equipment that needs it. When high-performance compute nodes pull cold air from the intake aisle, small pressure variations across the room can cause serious air management failures that no amount of extra chiller capacity fixes.
Two aerodynamic breakdowns account for most equipment shutdowns tied to cooling:
Exhaust air recirculation
High-pressure hot air discharged from the rear of server racks bypasses the return path and flows backward — over the top of enclosures, or through unsealed rack gaps (the empty slots in a rack, known as U-spaces) — straight back into the cold air a neighbouring server is trying to draw in.
Thermal stratification
In a vertical server enclosure, cold air naturally sinks and warm air rises. Without proper containment (physical barriers that keep hot and cold air from mixing), the servers in the top rows of a rack are consistently starved of high-velocity cold air, and can run measurably hotter than equipment near the floor tiles — a gradient significant enough to push top-of-rack intake temperatures outside the equipment’s safe operating range even when the room average looks fine.
Singapore’s Cooling Rules Just Got a Lot Less Forgiving
In many markets, operators eliminate hot spots the blunt way — lower the chilled water setpoint, or push more air through the room. In Singapore, that’s no longer a viable default, and as of 2026 it’s not just a best-practice question. It affects whether an operator gets access to capacity at all.
What SS 715:2025 and GM DC:2024 actually require
Singapore’s IT Energy Efficiency Standard, SS 715:2025, launched in August 2025 and sets two hard markers: it targets at least a 30% reduction in IT equipment energy consumption, and it specifies that hardware should be able to operate safely at ambient temperatures up to 35°C — well above what most facilities elsewhere are designed for. Paired with the earlier Tropical Data Centre standard (SS 697:2023), operators who run at these higher temperatures can realistically bank a further 2–5% in cooling energy savings for every 1°C they raise the operating baseline.
The BCA-IMDA Green Mark for Data Centres (GM DC:2024) sits alongside this, extending the efficiency requirement into intelligent systems, carbon reduction, and facility resilience more broadly.
Running hotter under these standards leaves an unusually narrow safety margin. A localised deviation of just 2°C can push a server’s intake temperature past the maximum allowable threshold set by ASHRAE (the industry body that publishes data centre thermal guidelines) — which is exactly the kind of failure a hot spot causes and a whole-room temperature reading won’t catch.
The new gate: DC-CFA2 and sub-1.3 PUE
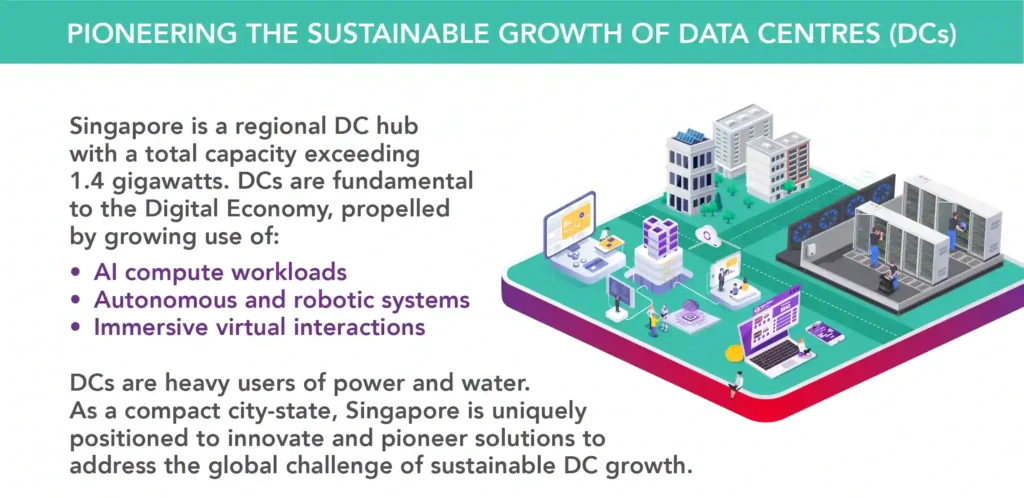
Here’s what changes the calculus for anyone planning new capacity in Singapore right now. In March 2026, Singapore opened its second Data Centre Call for Application (DC-CFA2) — roughly 200MW of new capacity up for allocation. To qualify, operators need to demonstrate a Power Usage Effectiveness (PUE — a ratio of total facility energy to the energy actually reaching the IT equipment; lower is better) below 1.3, at least 50% of power drawn from green energy sources, and best-in-class performance on both energy and IT efficiency. This sits on top of continuing land, power, and — increasingly — water constraints that limit how much new capacity Singapore can bring online at all.
In other words: sub-1.3 PUE isn’t an aspirational efficiency target anymore. For any operator seeking new allocation, it’s the entry requirement. That reframes cooling design from “how do we run efficiently” to “how do we clear the bar our competitors for capacity are also trying to clear” — and airflow modelling is the tool that tells you, before you build, whether your design actually gets there.
How CFD Simulation Works, Step by Step
1. Building the computational fluid domain
Engineers map the complete physical layout of the data hall — raised floor heights, structural pillars, overhead cable trays, perforated tile positions, and rack dimensions — into a 3D model.
2. Characterising thermal and mass influx
Real hardware parameters get mapped onto that model: localised heat loads per rack, fan curves, and CRAH (Computer Room Air Handler — the unit that cools and circulates air into the data hall) supply temperatures. This step matters more than it used to. A traditional enterprise rack still runs somewhere in the 10–15kW range, but AI training clusters routinely sit at 40–60kW per rack, large language model workloads can require 70kW or more, and the newest GPU platforms are pushing past 130kW peak — densities where air cooling alone starts to struggle and hybrid or liquid cooling (direct-to-chip or rear-door heat exchangers) typically becomes necessary above roughly 70–80kW. A CFD model built around outdated load assumptions will miss the exact hot spots a modern AI deployment creates.
3. Solving the airflow physics
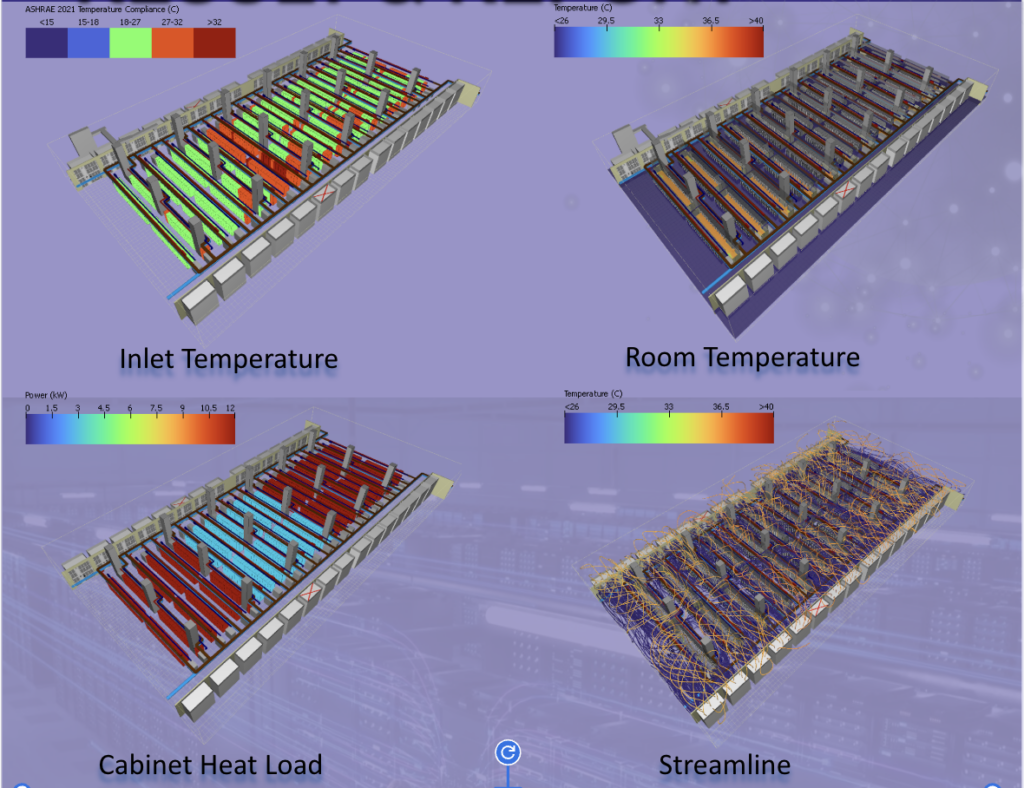
The CFD engine runs the Finite Volume Method (a numerical technique for solving fluid physics across a 3D grid) across millions of discrete cells, calculating localised air velocity, turbulence, and temperature differentials throughout the room.
4. Testing alternative floor and containment layouts
Engineers examine the resulting airflow patterns to find the weak points, then simulate fixes — adjusting perforated tile open-area percentages, adding physical aisle containment — to find the configuration that actually resolves the hot spot rather than just moving it somewhere else in the room.
What We’re Seeing on the Ground
The pattern we see most often isn’t a design that’s obviously wrong on paper — it’s a design that was correct for the load it was built for, and then quietly stopped being correct as rack density crept up. A hall provisioned for 10–15kW racks starts hosting 40kW-plus AI nodes in the same footprint, the original tile layout and containment plan doesn’t change, and nobody notices until a specific server starts throttling under load. The room-average temperature reading looks fine the whole time, because a hot spot by definition doesn’t show up in a room average — it shows up at one rack, usually near the end of a row or the top of an enclosure, exactly where a single-point sensor or a manual walkthrough is least likely to catch it.
This is the practical case for simulating before you retrofit rather than after: a CFD model will show you that specific rack’s airflow problem — and what fixes it — without the operator running a live experiment on production hardware to find out the hard way.
Choosing a Containment Strategy — and Knowing If It Clears the New Bar
| Cooling Topology | Airflow Behaviour | Where Hot Spots Still Hide | Typical PUE Range | Clears DC-CFA2’s sub-1.3 bar? |
| Open Aisle (Raised Floor) | High mixing of hot exhaust and cold supply air | Severe hot-air wrap-around at the top and sides of outer rack columns | 1.65 – 1.90 | No |
| Cold Aisle Containment (CAC) | Cold air physically sealed in the supply aisle, kept under positive pressure | Localised pressure drops if individual floor tiles clog with debris | 1.30 – 1.45 | Borderline to no |
| Hot Aisle Containment (HAC) | Hot exhaust isolated and ducted directly into the ceiling return plenum | High thermal loading on ceiling structures; needs airtight chimney sealing | 1.15 – 1.25 | Yes |
These ranges are industry-typical, not a guarantee for any specific facility — actual PUE depends on climate load, IT density, and how well the containment is sealed in practice, which is precisely what a CFD model is used to verify before construction rather than assume from a spec sheet. Worth being direct about what the table means for planning: under DC-CFA2’s terms, open aisle designs are no longer a viable choice for new allocation, and CAC sits close enough to the line that leakage — the kind CFD is built to find — can be the difference between qualifying and not.
How CFD Findings Turn Into Physical Changes
Dynamic perforated tile gradients
Rather than installing uniform 40%-open floor tiles across the hall, CFD findings guide engineers to deploy variable-flow tiles — for example, 60%-open directly in front of high-density blade servers — to even out pressure distribution across the room.
Containment leakage assessments
Simulation reveals the actual volume of hot air escaping through small gaps around brush modules and cable penetrations, so technicians know exactly which points are worth sealing rather than sealing everything and hoping.
N+2 cooling failure scenarios
Operators can safely simulate the sudden loss of two CRAH units running in parallel. The simulation shows how many minutes remain before heat build-up forces a server shutdown — the number that actually defines an operator’s redundancy procedures, rather than a generic industry assumption.
Working With a CFD Partner in Singapore and Malaysia
Navigating Singapore and Malaysia’s dense, tightly regulated data centre landscape takes specialised expertise — the rules above are current as of 2026 and have moved fast even within this year. Megagenix works with data centre operators across the region on thermal modelling, digital twinning, and BCA-IMDA compliance strategy, with the aim of helping infrastructure scale efficiently while staying protected from thermal downtime it didn’t see coming. As with any simulation-led approach, results depend on accurate inputs and proper implementation of the recommended changes — CFD tells you where the problem is and what fixes it; it doesn’t replace the physical work of sealing, tiling, and containment that follows.
Frequently Asked Questions – CFD Prevents Hot spots
How does the Singapore Standard SS 715:2025 impact data centre thermal modelling? SS 715:2025 requires at least a 30% improvement in IT equipment energy efficiency and expects hardware to run safely at ambient temperatures up to 35°C. For CFD engineers, this means simulations need precise boundary conditions to confirm that operating at these higher baselines doesn’t create localised hot spots inside high-density rack clusters — the margin for error shrinks as the baseline temperature rises.
What is airflow bypass, and how does CFD identify it? Airflow bypass happens when conditioned cold air from the cooling units returns to the intakes without ever passing through a server’s internal fans — wasting cooling energy without cooling anything. CFD tracks this through velocity vectors, showing engineers exactly where cold air is escaping through unsealed floor cutouts or open space at the ends of aisles.
Can CFD simulation model high-density AI infrastructure, including liquid cooling? Yes. Modern CFD tools handle hybrid data halls that combine traditional air cooling with high-density liquid systems — direct-to-chip or immersion cooling — calculating the heat transfer between the coolant, the solid heat sinks, and the surrounding air. This matters increasingly as AI racks push past the roughly 70–80kW mark, where air cooling alone typically stops being sufficient.
How long does a data centre CFD study take, and what does it cost? This varies by facility size, rack density, and how many containment scenarios need testing — a single-hall study is a materially different scope from a full-facility retrofit assessment. The most useful next step is a scoping conversation with the specific floor plan and rack loads in hand, rather than a generic timeline that won’t match the actual site.
Do I need a full CFD study, or is basic temperature monitoring enough? Sensor-based monitoring tells you the temperature at the points you chose to measure. It won’t tell you where an unmonitored hot spot is forming, or what a proposed containment change would do before you build it. CFD is the tool for the “before you commit” question — sensors are still essential for day-to-day operational monitoring afterward. The two aren’t a replacement for each other; they answer different questions.