This Computational Fluid Dynamics (CFD) study analyses how well a hybrid cooling system (bladeless fan/HVLS fan and air diffuser) keeps a room comfortable. Using real-world conditions, the study simulates airflow and temperature to see how they affect people’s experience in the room.
It considers factors like airflow patterns and temperature profiles to determine the overall comfort level. This helps us understand how effectively the cooling system creates a pleasant indoor environment.
Introduction
CFD simulations and analysis were conducted to assess the thermal comfort of a room equipped with a hybrid cooling system. The primary objective was to evaluate the performance of the bladeless fan and supply air diffuser while analysing velocity and temperature levels inside the room. Key input conditions included a maximum outdoor ambient temperature of 33°C and a supply air temperature of 15°C, along with additional parameters provided by the client, which are detailed in subsequent sections.
Thermal comfort refers to an individual’s satisfaction with their thermal environment, influenced by factors such as air temperature, relative humidity, radiant temperature, air velocity, and clothing insulation. Achieving optimal thermal comfort requires a balance of these variables to create an ideal indoor climate.
Through CFD thermal analysis analysis, airflow patterns, temperature profiles, velocity, and PMV values were evaluated to determine the room’s thermal comfort. Each piece of equipment was modelled with its operational conditions accurately represented in the simulation software, allowing for a comprehensive study of flow parameters and their behaviour.
Evaluate the temperature and airflow characteristics within the room utilising a hybrid cooling system.
Ensure the Predicted Mean Vote (PMV) value remains within the acceptable range for thermal comfort.
Identify strategies to sustain the room’s temperature below 26°C.
Scope of Work
The scope of this analysis includes:
Create a 3D CAD model based on the proposed layout and site measurements.
Generate a mesh and define simulation conditions, including flow rates and temperature settings.
Report the temperature and velocity distributions across various domain sections as determined by the CFD simulation.
Apart from this, we also perform FEA analysis to determine structural stresses and integrity of important components subjected to thermal and airflow conditions, thus providing you with a combined fluid and structural analysis in a single study.
Methodology
CFD Overview
CFD is a numerical simulation technique used to analyse fluid flow within a defined computational domain. The process relies on solving the governing conservation equations—such as the Navier-Stokes equations for mass, momentum, and energy—to describe the flow behaviour. The fluid region is divided into numerous smaller volumes, known as cells, where these conservation equations are applied. Numerical methods are also used to solve these equations simultaneously.
Modelling Strategy and Assumptions
The flow is assumed to be three-dimensional (3D), steady-state, incompressible, and turbulent.
Conservation equations for continuity, momentum, and energy are solved in 3D spatial dimensions (x, y, z) alongside equations for the turbulence model.
An external domain is established to enclose the room area under analysis.
Geometry Description
Comprehensive 3D Modelling – Level 6 Room 1
Data Input
Simulation Settings - Meshing
CFD Analysis Results
These were the results of the CFD Analysis:
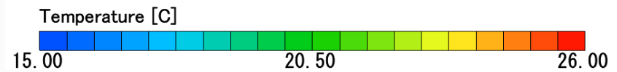
Temperature Distribution
The room’s air velocity is below the desired value, which is within the acceptable range for thermal comfort.
Temperature distribution at a height of 0.6m.
Temperature distribution at a height of 1.2m.
Temperature distribution at a height of 1.8m.
Temperature distribution at section view.
Velocity Distribution
The room’s air velocity is below the desired value, which is within the acceptable range for thermal comfort.
Velocity distribution at a height of 0.6m.
Velocity distribution at a height of 1.2m.
Velocity distribution at a height of 1.8m.
Velocity distribution at a height of 2.5m.
Velocity distribution at section view.
PMV Value Distribution
The target PMV is maintained between the optimum range, ensuring the room falls within the acceptable range for thermal comfort. However, during actual operation, the supply air volume can be adjusted to achieve a neutral PMV value for optimal comfort.
The highest velocity in the room is 1.08m/s, observed at a height of 1.2m from the floor level.
Ambient temperature can be maintained below 26°C.
The lowest Predicted Mean Vote (PMV) at a height of 1.2m from the floor is approximately -0.99.
The overall design meets human comfort criteria, including optimal velocity, temperature, and PMV values.
Recommendations
The air conditioning system has sufficient capacity to maintain these conditions. In real-world operation, the supply air volume can be reduced to further optimise thermal comfort, adjusting the PMV value toward a more neutral range if necessary. This adjustment would also enhance energy efficiency by reducing power consumption and saving energy.